WHMCS Uptime Monitoring: Automatic Monitors, Incidents and Customer Visibility
Automatically monitor newly provisioned WHMCS services, confirm incidents and show customer availability. Explore PD Uptime & Status and Pro status pages.
A hosting business can provision a website automatically and still forget to monitor it. The order completes, the service becomes active and the customer starts using it, but the monitoring list depends on somebody remembering another task.
PD Uptime & Status brings automatic service monitoring into WHMCS. Eligible services get a monitor when they are provisioned, using their domain. Confirmed failures open incidents, recovery closes them, and alerts report the change. Customers can see availability on their own service page; Pro adds a branded public status page, certificate checks and TCP port monitoring.
That connects monitoring to the business system that already knows what you sell. For a hosting company or agency growing its customer base, the benefit is coverage that can grow with new services, without creating a separate monitoring account or manually recreating each new website elsewhere.
Make monitoring part of the hosting service lifecycle
Automatic enrolment is the defining feature. You choose which WHMCS products to watch, or leave the selection empty to watch everything you provision. When an eligible service with a domain is provisioned, PD Uptime & Status creates its monitor.
When that service is terminated, the module removes the monitor it created. Manually added monitors remain under your control and are not removed by that automatic cleanup. Services without a domain are skipped rather than producing a meaningless website check.
Imagine a small hosting company introducing a new managed WordPress product. The team selects that product for monitoring. Each newly provisioned customer site then joins the monitoring workflow alongside its hosting service, rather than waiting for a staff member to copy the domain into another list.
This is an illustrative workflow, not a reported customer result. Its value comes from the relationship: the product you sell determines which new services should be watched, and the service lifecycle determines when their automatic monitors should be retired.
For an existing customer base, plan the initial coverage separately. The documented provisioning workflow does not mean every historical service is immediately checked. Add existing targets manually where needed and verify the monitor list, rather than assuming that enabling automatic enrolment has backfilled it.
Website monitoring that can recognise the expected page
A simple HTTP check answers whether a URL responds successfully. That is useful, but a successful response can still be the wrong page: a holding page, an unexpected maintenance message or a site that has lost its intended content.
PD Uptime & Status includes HTTP and HTTPS website checks, with an optional required keyword. The response must then contain text you expect to see, giving you a practical way to distinguish the intended website from a page that merely returns a successful response.
For example, an agency could monitor a customer’s homepage and require a distinctive piece of site text. If the hostname starts serving a generic placeholder instead, the check has more information than the response code alone. Choose text that is stable enough for normal editorial changes; a temporary campaign headline would be a poor monitoring target.
The website check treats successful and redirect responses as up, and redirects are followed by default. A normal move from HTTP to HTTPS or from the bare domain to its www address therefore does not need to look like an outage.
This is availability monitoring with a useful content condition. It does not simulate every checkout, sign-in or application action. Use it to observe the page you chose, and keep any separate application testing suited to your service.
See the monitored estate in one WHMCS workspace
The Monitors view puts targets, observed states and checking history together. Staff can review what is being watched, add a target manually and request an immediate check through Check everything now.
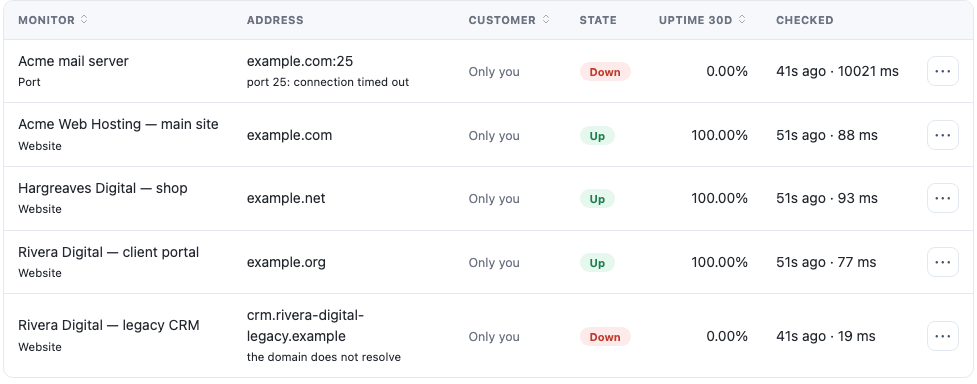
*Actual product screen, cropped to the monitor table. Names and reserved example domains are demonstration data. Displayed uptime percentages and failures illustrate the interface, not PD Hosting service performance. Port checks require Pro.*
Manual monitors are useful for services that do not originate from the automatic enrolment workflow. A host might want to watch its own website or another relevant endpoint alongside customer hosting services. Those targets remain deliberately managed rather than being tied to a customer’s termination event.
The useful operational question becomes “is this target represented and being checked?” Staff can answer it in WHMCS, where the service relationship is already familiar, instead of treating the monitoring list as an unrelated inventory.
Confirm failures before opening an incident
A single timeout should not necessarily create the same response as a persistent failure. PD Uptime & Status lets you choose how many consecutive checks must fail before a monitor counts as down. The documented default is two; the threshold is configurable.
Once that condition is met, the module opens an incident with the reason. A successful check clears the down state and closes the incident, retaining its duration. Staff can review the incident history to understand when the observed condition began and when it recovered.
This gives a hosting team a more useful sequence than a stream of isolated messages: a confirmed change, an incident to inspect and a recorded recovery. The threshold is a choice about sensitivity and detection time, so it should suit the service and the checking interval.
The module also distinguishes a target failure from a check that cannot run. If the monitoring server cannot make the required outbound request, or lacks what a certificate check needs, the result is inconclusive. It does not count as the customer’s outage or open an incident on that basis.
That distinction helps preserve the meaning of the status. A problem with the monitoring environment should be visible to the operator without being mislabelled as evidence that every monitored customer website has failed.
Alerts that follow changes, with a Pro webhook route
Email alerts fire when the confirmed state changes. With recovery messages enabled, staff receive a down notification and a recovery notification, rather than another email for every unsuccessful probe during the same incident.
Choose the addresses that should receive those alerts. A small team can direct them to its operational mailbox; a larger team can align them with its normal response process. The goal is a useful signal that somebody owns, rather than a growing pile of repeated checks.
Pro adds an HTTPS webhook alongside email. The documented payload supports Slack and Discord incoming webhooks, so the observed transition can reach a team channel as well as an inbox. This is a notification route, not a claim that the module manages conversations or incident assignments in those platforms.
For a host with staff working different shifts, a shared channel can make the change visible where the team already coordinates. The incident history remains available in the module for the timing and reason behind that notification.
Give customers availability information beside their service
Hosting customers often open their service page when they are unsure whether a problem is local to them. PD Uptime & Status can place an Availability panel there with the current state, recent interruptions and uptime over the recorded period.
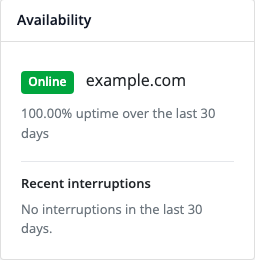
*Actual customer-panel crop using example.com. The demonstration percentage is sample data, not an uptime promise. The panel gives a customer visibility into their own service without requiring you to publish that monitor publicly.*
The placement matters. A customer does not need to know the name of a separate monitoring dashboard or ask staff where to look. Availability sits with the service they already recognise in their account.
The percentage is calculated from recorded checks. Where there is not enough history, the module shows that limitation rather than inventing a perfect result. It is a record of what the configured checks observed, not a contractual guarantee or a complete test of every application function.
Useful visibility can answer routine status questions and give a support conversation a common starting point. It does not require every article or every customer interaction to become a fault-reporting workflow.
Publish a branded WHMCS status page with Pro
A public status page serves a different audience from the private service panel. It gives visitors a shared reference for infrastructure you choose to show, such as your mail platform, control panel or public website.
PD Uptime & Status Pro includes a branded status page with current states and incident history. It is off until you enable it, and it displays only monitors you explicitly publish. Incidents for unpublished monitors do not appear there.
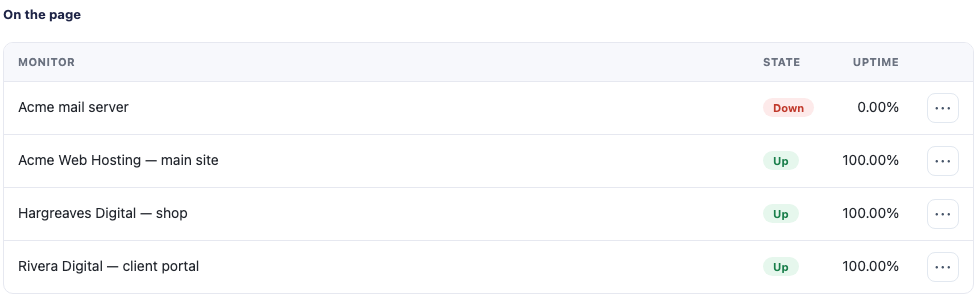
*Actual Pro administration view of the monitors selected for a status page. These are sample names and results. The screen demonstrates the publication selection; it is not a live status report.*
A sensible hosting-company arrangement is to publish shared infrastructure and leave individual customer sites private. Customers can still see their own availability panel while the public page communicates the state of common services.
You can then link that page from the places people look during an interruption: your website, service communications or out-of-hours information. The module supplies observed status and history; your team can continue to communicate any wider business context through its usual channels.
Pro certificate and TCP port monitoring
Website checks cover an important part of hosting, but they do not answer every availability question. A web page can work while a mail port is unreachable, and an expiring TLS certificate deserves attention before customers encounter it.
Pro adds TCP port checks for targets such as mail services, databases and control panels. The check establishes whether the selected port accepts a connection. It does not send a complete email or execute a database transaction, so choose it for the specific reachability question it answers.
Certificate monitoring reads the hostname’s TLS certificate and raises a failure as it approaches expiry. That brings certificate renewal visibility into the same incident and alerting workflow, rather than relying entirely on somebody noticing a date elsewhere.
Together these checks let a host choose a meaningful set of observations: the website responds with expected content, a relevant service port is reachable and the certificate is not nearing expiry. Label the targets clearly so staff understand which condition changed.
Free website monitoring and a clear Pro expansion
The free tier includes website checks, failure confirmation, incidents, email alerts and the customer availability panel for up to ten monitors. Pro removes that monitor limit and adds the public status page, certificate checks, TCP checks and webhook notifications.
Monitors beyond the free allowance remain listed but are not checked, and the interface identifies that state. A listed target and an actively checked target are therefore different things to review when choosing the edition for your estate.
Checks run from your own WHMCS server through its cron. There is no separate uptime-service account to create for this workflow. The actual checking frequency depends on both the configured interval and how often your WHMCS cron runs.
For example, selecting a short interval does not make a slower cron execute more frequently. Choose the monitoring interval with that runtime in mind, and verify the initial results before describing the coverage to customers. This is monitoring from your WHMCS environment, rather than a claim of distributed probes from locations around the world.
Build on the evidence in customer care reports
Availability data can also contribute to an ongoing service story. If you use PD Care Reports for WHMCS, its documented uptime integration can bring monitoring observations into customer reports.
That is useful for agencies and managed hosting businesses that want to show work and service history over time. The status panel answers a current question; a care report can place recorded uptime alongside other supported report information. Neither needs a fabricated performance promise to explain its value.
Explore PD Uptime & Status for WHMCS
If your monitoring coverage depends on staff remembering every new customer domain, automatic enrolment is worth examining. PD Uptime & Status connects new-service monitoring, confirmed incidents, change alerts and customer visibility in the system you already use to run the hosting business.
Explore PD Uptime & Status for WHMCS for the current module and edition details. Use the WHMCS module knowledge base for practical configuration guidance alongside the in-panel documentation.
Frequently asked questions
Does PD Uptime & Status need a separate monitoring-service account?
No. Its checks run from your WHMCS server through the WHMCS cron. Pro webhooks can optionally send alerts to a configured HTTPS notification destination.
Can WHMCS hosting services get monitors automatically?
Yes. With automatic watching enabled, eligible services with a domain receive a monitor when provisioned. You can restrict watching to selected products and review existing services separately when rolling out monitoring.
Can it detect a website returning the wrong page?
A website monitor can require an expected keyword. That can detect a placeholder or other unexpected response that still returns a successful HTTP status, provided the chosen content condition distinguishes it.
Does one failed check immediately mark a service down?
The consecutive-failure threshold controls that. The documented default requires two failures before the down state and incident, while a successful check records recovery.
Can customers see their own uptime inside WHMCS?
Yes. The optional Availability panel on their service page shows the current state, recorded uptime and recent interruptions without making the monitor public.
Is the WHMCS public status page included in the free tier?
The public status page is a Pro feature. It is enabled deliberately and includes only the monitors you choose to publish. Website checks, incidents, email alerts and the customer panel are included in the free tier within its allowance.
Can PD Uptime & Status monitor mail ports and TLS certificate expiry?
Yes, with Pro. TCP checks observe whether the chosen port accepts a connection; certificate checks identify approaching TLS expiry. These are separate from an HTTP website check.
How quickly will it notice a failure?
That depends on the configured interval, the actual WHMCS cron frequency and the number of consecutive failures required. It is not an instant-detection promise; choose those settings together for the service you want to watch.