PD Uptime & Status — Self-Enrolling Uptime Monitoring, Incidents & Status Page
Monitors that create themselves — every service you provision is watched from the moment it goes live
Made and supported by Projektif Digital Ltd.
Runs inside PD Modules, the panel
every module installs into.
Monitoring & Alerts
Every service you sell is watched from the moment it goes live — no separate account to set up, no monitor to add by hand.A clear record of every outage — when it started, how long it lasted and why — so a customer question is answered without digging through logs.The customer-facing side of Uptime & Status, on their own service page.1 / 3
PD Uptime & Status watches every service you sell, automatically. The moment a service is activated in Blesta, a monitor is created for its domain. It is checked on a schedule from your own server, an incident opens when it stops answering, you get one email when it goes down and one when it recovers, and your customers can see their own uptime in their client area. There is no third-party monitoring account to open and no list of sites to maintain.
It is built for hosting companies and agencies who want to know about an outage before the customer gets in touch, and who want to answer "was my site down?" with a record rather than a guess. The core is free; Pro adds certificate and port checks, a public status page and webhook alerts.
Why hosts choose PD Uptime & Status
Coverage that keeps up with your sales. Monitors are created when a service is activated, using the domain on the service, and removed when it is terminated. Nothing depends on someone remembering to add the new customer. A service with no domain is skipped rather than watched pointlessly, and a monitor you added by hand is never deleted behind your back.
Alerts you will still trust in a year. A monitor must fail several checks in a row before it counts as down (two by default, one to five as you choose). Alerts go out on the change only: a four-hour outage sends two emails, not forty-eight. When your own server cannot run a check, the result is recorded as inconclusive. No incident, no alert, no customer marked down because of a problem at your end.
Checks that catch the real failure. A website check treats any 2xx or 3xx as up and follows redirects, so http to https to www is success. Add a keyword the page must contain and a parked page, a database error or an "account suspended" screen is detected as the outage it is.
A real record of every outage. Each confirmed outage opens an incident with the reason, and closes it on recovery with the duration. The Incidents tab is the history you point to when a customer asks what happened and when.
Fewer "is it down?" tickets. Customers see their current state, 30-day uptime and recent interruptions in their own client area. Where there is not yet enough history, the panel shows a dash, never a flattering 100%.
Nothing to sign up for, nothing metered. Checks run from your Blesta server on your own cron. Nothing leaves it except the check itself, and no third-party service is billed.
How it works
Install it. PD Uptime & Status installs from PD Modules in one click. Automatic enrolment is on by default.
Choose what to watch. Pick packages from a searchable list, or leave it empty to watch everything you provision.
Checks run on your cron. Each monitor is checked every 5, 10, 15 or 30 minutes (5 by default). Nothing is checked more often than its interval, however often the cron fires.
You hear about changes, not noise. A confirmed outage opens an incident and emails you. Recovery closes it and tells you.
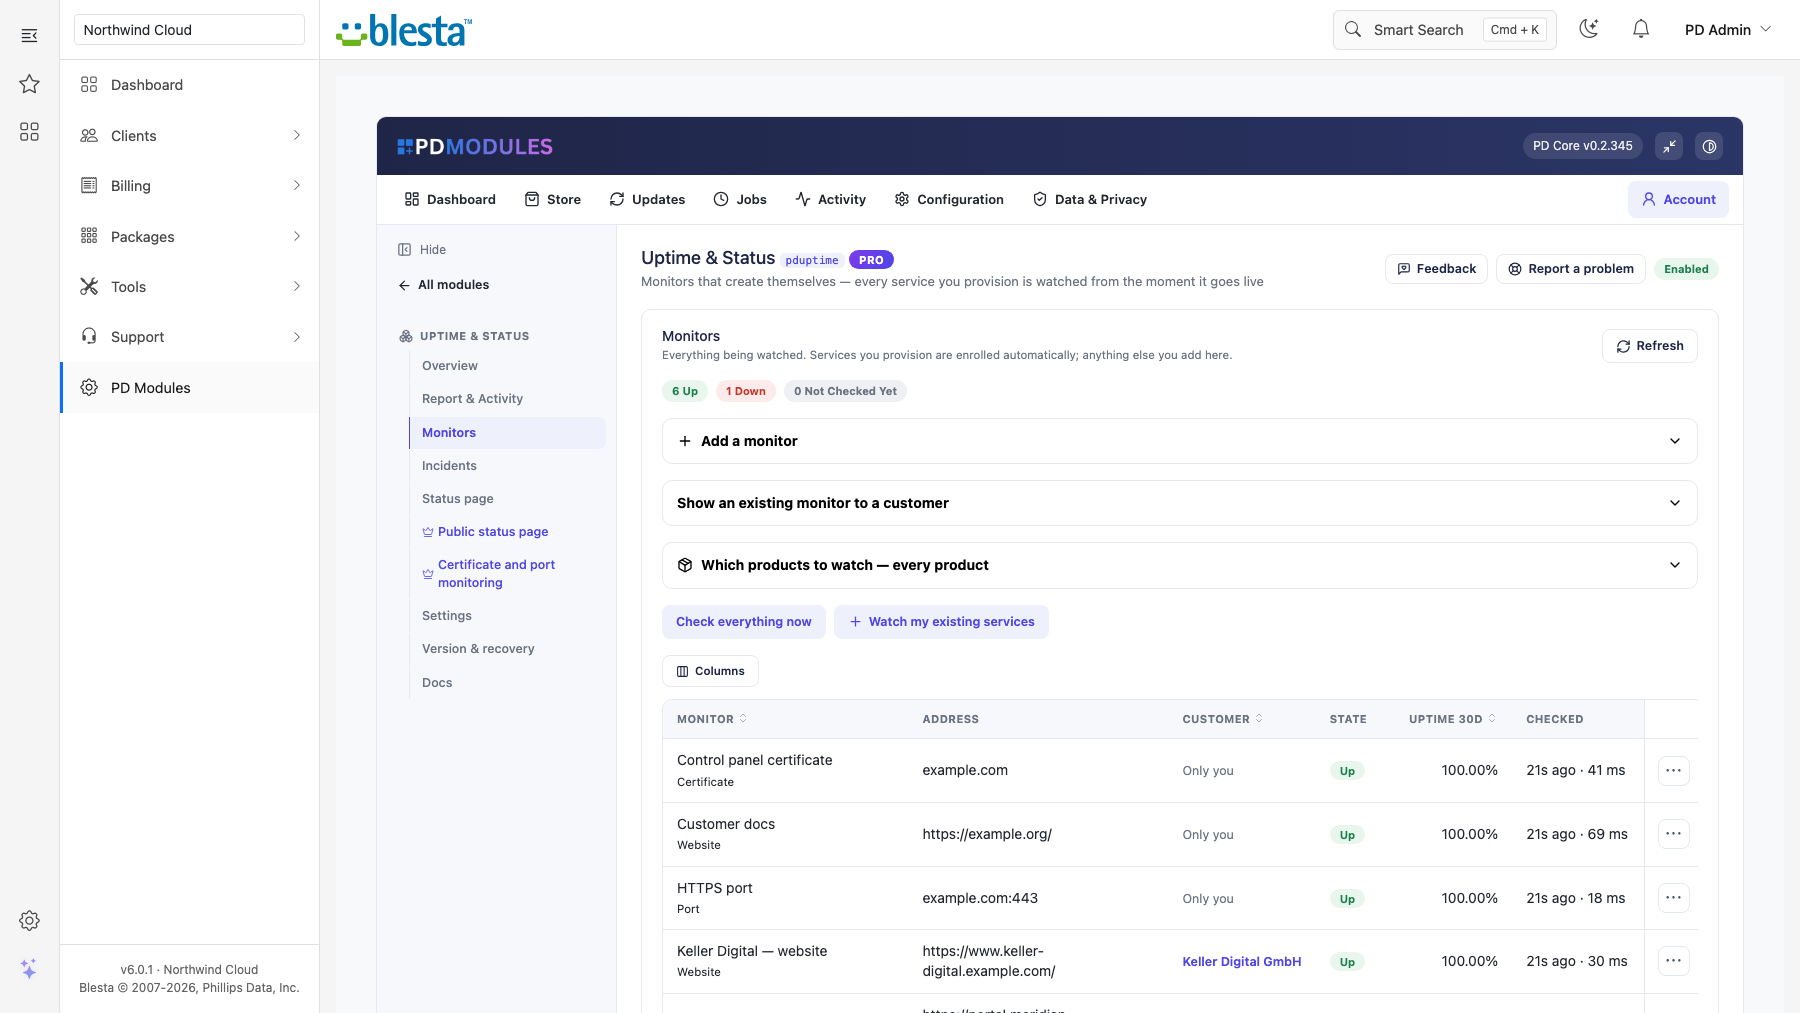
The Monitors tab: websites, ports and certificates with live state and 30-day uptime, and a customer name beside the ones that belong to one
What you get in Blesta
Monitoring
Website checks, free: 2xx and 3xx count as up, redirects followed by default, optional keyword the page must contain
Pro: TCP port checks for mail, databases, control panels and anything that is not a website
Pro: certificate checks that fail within 21 days of expiry, naming the exact date, and fail again if it has expired
A timeout of 3 to 30 seconds per check (10 by default): each check is one request with no retries, and a slower site counts as a failed check
Check everything now, from the Monitors tab, whenever you want an answer immediately
Old check results are pruned automatically, so the tables never grow without bound
Alerts
Email to the addresses you set, or to your Blesta system address
One message when a monitor goes down and, optionally, one when it recovers
Pro: the same alert as a JSON POST to any HTTPS webhook, sent as well as email. Slack and Discord incoming webhooks work as they are
Running it day to day
A Monitors list with state, 30-day uptime and last-check time for every monitor
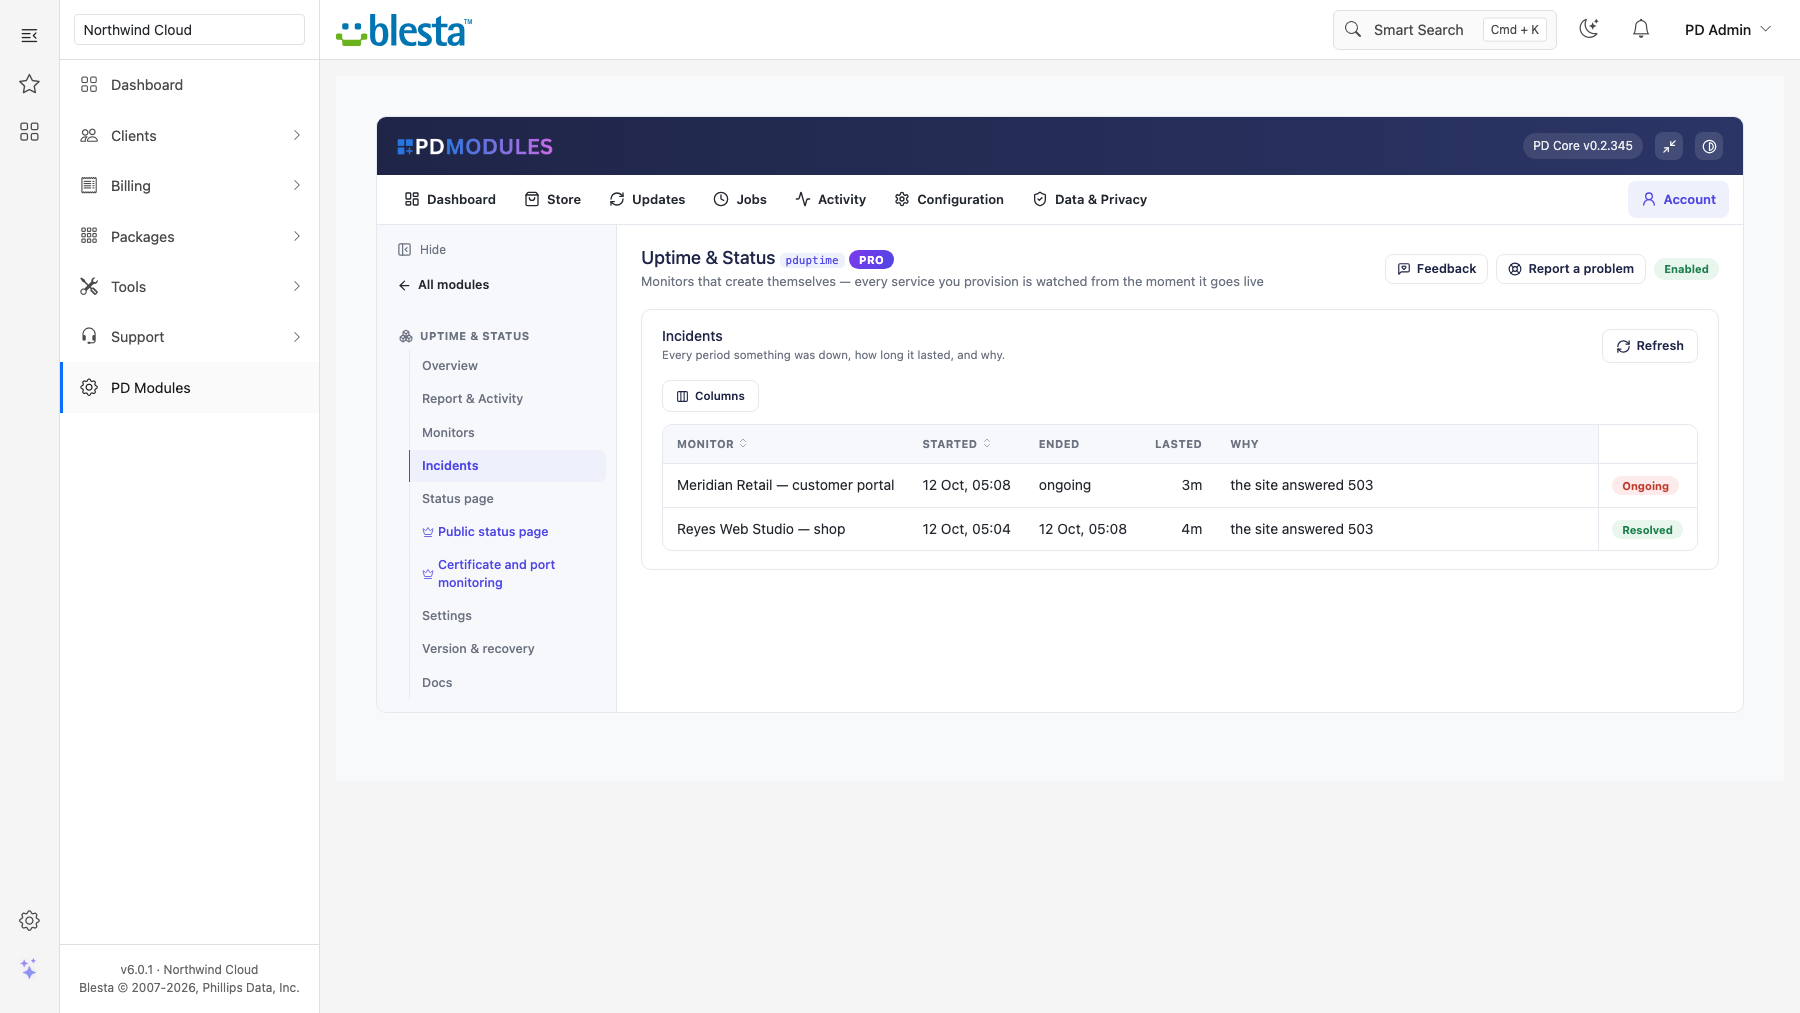
An Incidents list: every period something was down, how long it lasted and why
Add a monitor by hand for anything that is not a hosting service. It behaves like an automatic one and is never removed automatically
Pro: a status page that shows only the monitors you publish, with your own heading and 7 to 90 days of history
The Incidents tab: every outage with when it started, how long it lasted and why
What your customers get
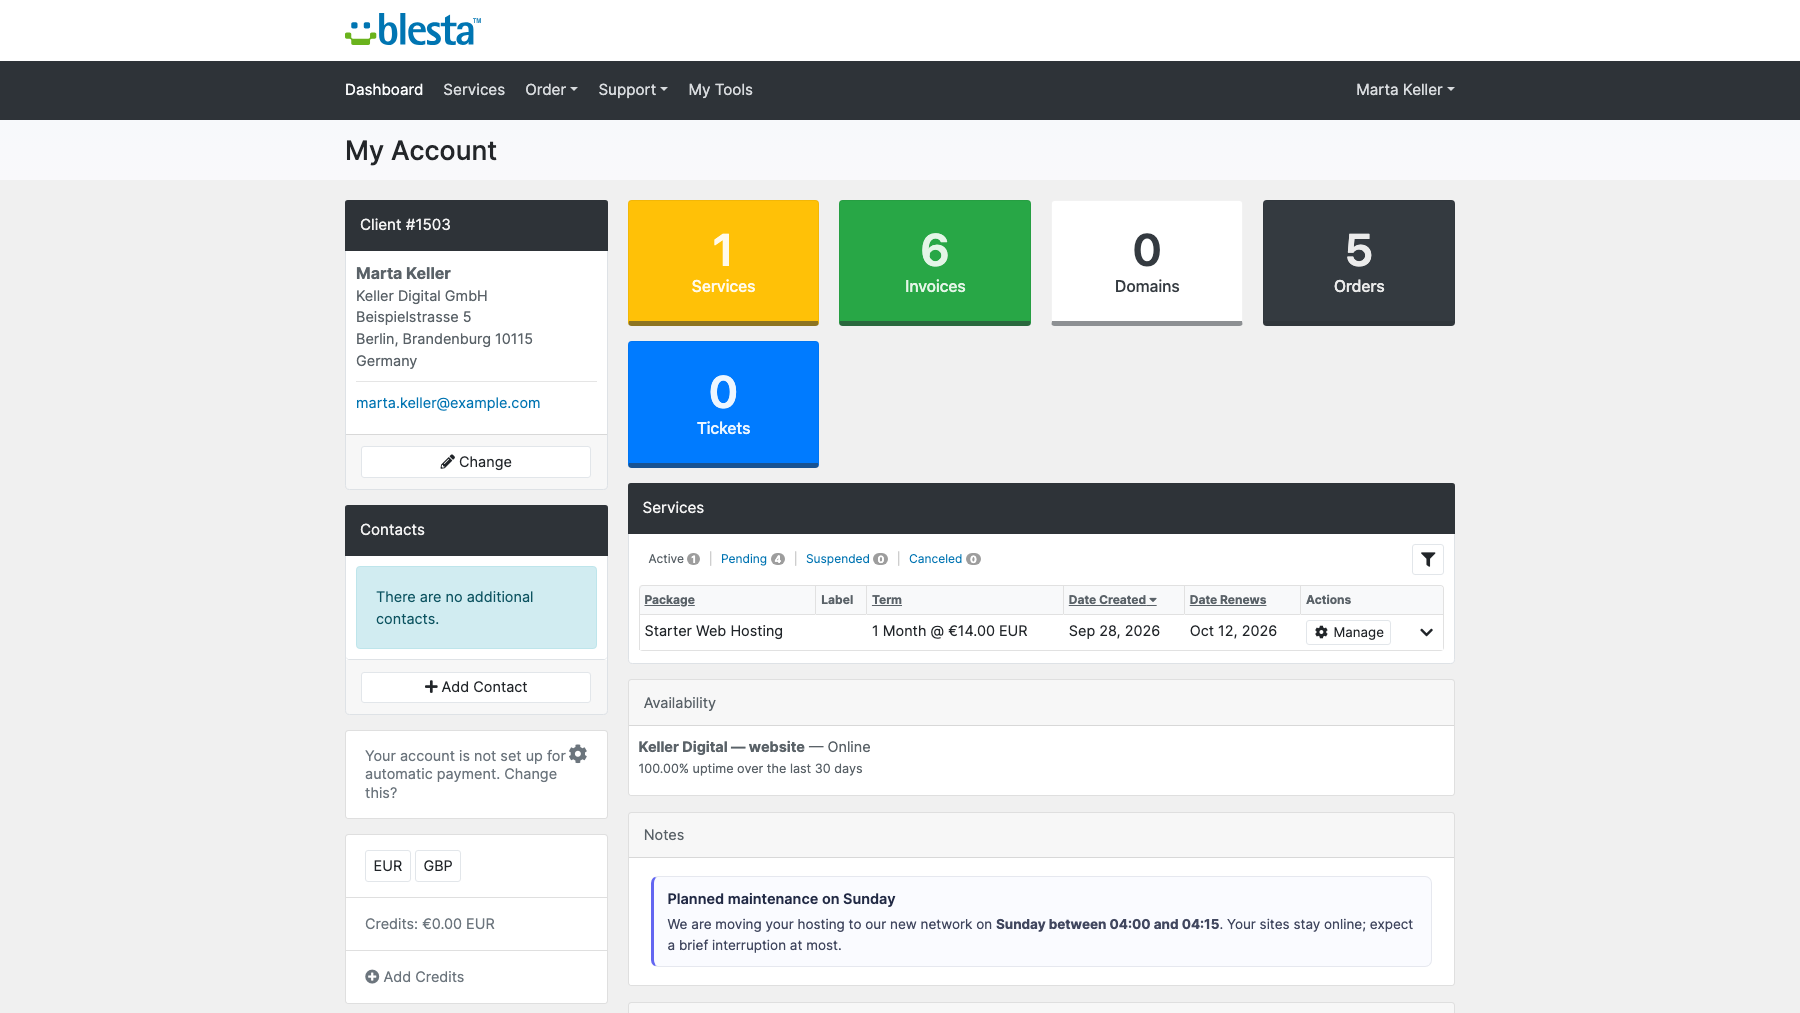
Their own availability in the Blesta client area: current state, 30-day uptime and recent interruptions, for their services only
Honest numbers. Uptime is successful checks divided by all checks in the window. With no history it shows a dash, and inconclusive checks are not counted
A status page to read instead of a ticket to open (Pro), showing the shared infrastructure you choose to publish
The panel appears on the client-area home and on the service's Notes & extras tab, for packages that have PD Modules ticked under Plugins. It is on by default and has a single switch.
The customer's client area: an Availability panel with current state and 30-day uptime for their website
Security built in
The status page is not served at all until you switch it on, so nothing becomes public by accident.
It shows only monitors you publish. An incident on an unpublished monitor is never shown, however many there are.
A customer sees only their own monitors, never another customer's.
Free, with a Pro tier
PD Uptime & Status is free. Automatic enrolment, website checks, keyword checks, confirmation, incidents, email alerts and the customer panel cost nothing, for up to ten website monitors (you can set the free limit from 1 to 25). Anything beyond the limit is listed and clearly labelled as not checked, so you are never left believing something is watched when it is not.
Pro is £12 per month. It lifts the limit and adds certificate and port monitoring, the public status page and webhook alerts. It upgrades in place on the same licence, with nothing to reinstall.
If Pro lapses you get a 14-day grace period with everything working. After that, monitoring carries on as the free tier: your monitors and history are kept, the status page stops being served and certificate and port monitors stop being checked. Nothing is deleted.
Requirements
Blesta 6 or later and PHP 8.2 or later, with the ionCube Loader
cURL, plus OpenSSL for certificate checks, and a working Blesta cron
PD Modules (free), which installs PD Uptime & Status
Questions
Do I need an account with an uptime service?
No. Checks run from your own Blesta server on your own cron. There is nothing to sign up for and nothing leaves your server except the checks themselves.
What does "monitors that create themselves" mean?
When a service is provisioned, a monitor is created for its domain automatically; when the service is terminated, that monitor is removed. You never have to remember to add or clean one up — the difference between monitoring everything and monitoring the three things you thought of.
Will one slow moment page me at 3am?
No. A monitor must fail the number of checks you choose (two by default) before it counts as down, and alerts fire only when the state changes. A four-hour outage sends two emails: down, and back up.
What if my server cannot make outbound requests?
The check is recorded as inconclusive — not as your customer's outage. Nothing is alerted and no incident is opened, and the monitor's last error tells you what happened at your end.
Does the status page expose my customers?
Only if you choose. Nothing appears unless you explicitly publish that monitor, and incidents for unpublished monitors are never shown. Most hosts publish shared infrastructure and keep customer sites private.
What is the keyword check for?
The failure a plain up/down check misses: the site answers with a 200 but the page is parked, showing a database error, or a suspension notice. Requiring a word you expect turns that into a detected outage.
How is uptime calculated?
From the recorded checks over the window — successful divided by total. Where there is not enough history yet the figure shows as a dash rather than a misleading 100%.
What happens if Pro lapses?
Monitoring carries on as the free tier. Your monitors are kept, the status page stops being served, and certificate and port monitors stop being checked. Nothing is deleted.
How often does it really check?
Checks run on your Blesta's cron, so your cron interval is the floor. With a one-minute cron and the default five-minute interval, each monitor is checked every five minutes — and never more often than its interval, however often the cron fires.
Does this expire, or turn into a paid version later?
The free tier never expires — it arrives with your PD Modules licence and keeps working, with no trial clock and nothing that switches off later. If you add Pro and then let it lapse, only the Pro features step down, in stages: a 14-day grace period where everything still works, then the Pro features lock and the module carries on as the free version. Nothing is deleted, nothing you configured is lost, and adding Pro again restores it immediately.
What does it cost to run, on top of the subscription?
Nothing metered. The free tier costs nothing, Pro is a flat subscription, and PD Uptime & Status runs inside your Blesta without connecting to a paid third-party service — so there is no usage bill, no per-message or per-GB charge, and no surprise on top of what you chose to pay.
What data leaves my server?
Your customers' data stays in your Blesta. To confirm your licence, the platform sends us four things and nothing else: your licence key, the domain, your server's own IP address and the directory it is installed in — the four values recorded against your licence in your client area. Alongside that we see which module and version you run and whether its licence is healthy, so we can ship compatible updates. We never receive your clients' personal data, your credentials, or the contents of your Blesta. Crash reports are off unless you turn them on, and a diagnostic report is only ever sent when you send one, after showing you a preview you can edit.
Which Blesta and PHP versions does it need?
Blesta 6.0 or later, on PHP 8.1 or later. It installs alongside whatever else you run — it adds its own tables and templates rather than modifying Blesta files, so it does not collide with other vendors' modules or with a customised template. Uninstalling removes its own tables and settings and leaves no orphans behind.
How do I get help?
Open a ticket from your client area, or use Get help inside the PD Modules panel, which attaches a diagnostic report — you see a preview of exactly what it contains, and can exclude any part of it, before anything is sent. Support is included with an active subscription; bug reports are welcome whatever your licence state.
What’s new in 0.2.24
Customers also see their service's uptime and recent incidents on its Notes & extras tab, on packages where PD Modules is ticked under Plugins.
"Check everything now" checks every monitor straight away, including ones checked a few minutes ago.
Without Pro, the ten oldest website monitors are the ones checked — the Monitors tab now shows exactly those, instead of the free tier checking every monitor in rotation.
The status page keeps its published incident history however many private monitors have had problems.
Customers now see the availability of their own services on their client-area home.
Messages name your billing platform correctly.
Choose which products to watch from a searchable list, instead of typing product numbers.
The public status page link now opens.
Tables keep long explanations readable on narrower screens.
Links on this module's screens open the right client, service and product pages on every platform.
 Featured